DPI Rates 0 Districts 1 Star, Half of All Schools 4 or 5 Stars on New School Report Cards
DPI’s rankings make report cards mostly meaningless
Delafield, Wis. – The Institute for Reforming Government (IRG) released the following statement following the release of 2025 district and school report cards using a lenient formula, resulting in no Wisconsin school districts being rated 1 star.
The new report card formula forces parents to play a guessing game about where their children can learn best because the rankings correlate with poverty, inaccurately characterizing student achievement. The report cards set low standards for all schools, benefit low-poverty schools over high-poverty schools, and inaccurately assess school quality across the entire state.
THE RESULTS:
- DPI says there is not a single 1-star district in all of Wisconsin: not Milwaukee, not Racine, not Monona Grove, not Merrill.
- DPI says 51% of schools are 4 or 5 stars, up from 2024. This is despite mediocre test scores compared to other states and insufficient academic recovery since the pandemic.
- DPI says lower-poverty, low-performing districts like Lodi, Lake Mills, and Saint Croix are 4 or even 5 stars. Even worse, DPI says higher-poverty, high-performing districts like Wisconsin Dells, Sheboygan, and Janesville are just 3 stars.
THE QUOTE:
“DPI’s state report cards say rich districts are worth the property taxes, even when they aren’t, and poor districts meet expectations, even when they don’t. Meanwhile, DPI underrates many of Wisconsin’s best districts,” said Quinton Klabon, Senior Research Director at the Institute for Reforming Government. “Parents should not have to play a guessing game about where their children can learn best.”
DIG DEEPER:
- DPI’s calculation of graduation, attendance, and absenteeism inflates ratings for all schools, making a 1-star overall rating nearly impossible. For example, 17.1% of Beloit students do not graduate in 4 years, but DPI awarded Beloit a 5-star graduation rating.
- DPI benefited low-poverty schools twice. By lowering Forward Exam standards in a way that disproportionately raised Advanced scores in the mathematics section, DPI doubled the amount of children scoring in the highest category (21.1% in 2025 compared to 9.5% in 2023). DPI’s changes to report cards also resulted in the average Achievement score, measuring test proficiency, rising from 60 to 65. For example, Verona received a large boost from these changes despite average mathematics performance.
- DPI’s Growth score, measuring actual achievement against expected student achievement, helps create erratic results across the state. For example, DPI rated the low-performing Destiny High 3 stars due to supposed 5-star Growth.
THE DATA:
Wisconsin’s report cards inflate school performance. This table shows the number and percentage of districts and schools.
|
STARS |
# DISTRICTS | % DISTRICTS | # SCHOOLS | % SCHOOLS |
| 5 | 42 | 10% | 305 | 14% |
| 4 | 169 | 40% | 771 | 36% |
| 3 | 184 | 44% | 710 | 34% |
| 2 | 25 | 6% | 245 | 12% |
| 1 | 0 | 0% | 78 | 4% |
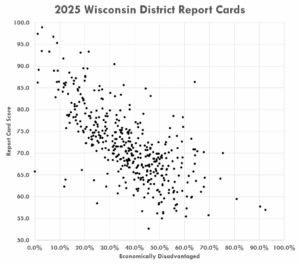
DPI’s current report cards measure school poverty, not school productivity. This graph shows that report card score highly correlates with the percentage of economically disadvantaged students. Accurate report cards would identify high-scoring poor, middle, and rich districts, not rank schools based on student poverty.